Web Scrapping
GitHub: - SEE CODE
What is Web Scraping?
In today's highly digitized environment, it is becoming increasingly crucial to identify and utilize various methods for accessing and utilizing the vast amounts of data available. Web scraping refers to the practice of extracting information from websites and converting it into a format that can be leveraged for insightful analysis.
How does it works?
Websites are
designed for human consumption, not
for computer processing, making it
challenging for machines to
understand what information is being
sought. The URL is utilized to
extract the HTML tag content of a
website, which contains the design,
content, and data being sought.
More advanced websites are
constructed using CSS and various
Java frameworks, making the
extraction of data more complex. Web
scraping involves harvesting all the
data on the website and then using
programming techniques to filter and
identify the relevant information.
After data collection, it is
frequently converted into a CSV or
Excel format for further analysis.
Ways of Scrapping
Web scraping can be performed using various programming language packages, such as Python or R. Additionally, programmers may also utilize available APIs to extract data in a more organized and structured format
In Our Project
We have used
the libraires of python to scrap
the data from website
https://www.worldometers.info/gdp/gdp-by-country/
( Worldometers )
Objective of Scrapping
Our primary goal is to gather the Gross Domestic Product (GDP) information for all countries available on a website and conduct a comparative analysis to assess the global GDP status and determine each country's relative position. To accomplish this, we will utilize web scraping techniques such as BeautifulSoup or Scrapy to extract the necessary data and store it in a well-organized format, such as a CSV file or a database. Subsequently, we will employ data analysis and visualization tools, such as Pandas, Matplotlib, or Seaborn, to perform a comprehensive comparison of the GDP data and present the results through informative visualizations.
The packages that we have used are Pandas, NumPy, requests and bs4.
Pandas:
- Is the package used
for data management and
manipulation
NumPy:
- Is the package used
for numeric operations
Request:
- Is the package that is
used to send HHTP
request by using python
on to the host to get
the website data, it has
different methods like
get (), post (), request
()
Bs4:
- Is the python package
used to beautify the
data
By
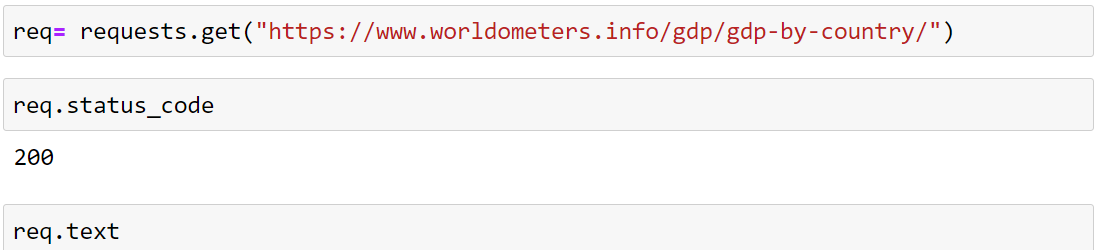
using the function request.get(URL)
we are sending the
request to the website
host for the data and in
return, we are getting
the data that we are
saving in the carriable
name “req”. in this
syntax request is the
package and get() is one
of its function.
req.status_code
:- if every thing goes
correctly and we get the
data in return the
output of the code
req.status_code will be
200, and now we can use
req.text
to see the data that we
have received. In this
case, we can say req is
the variable holding the
object of the bs4 and
text is its attribute
not function.
As you see the result of req.text is the data we got from the website it is unclear and unorganized, to organize this data beautifully we use the bs4 package function BS(req.text,'html.parser')and save it in the variable soup. The BS() beautify the HTML code we received. print(soup.prettify()[:2000]) shows the output of 2000 rows


The soup.title gives the title tag and its content but as we only need the text inside the tag we add soup.title.text in the output we will get the Content of the title tag which is 'GDP by Country - Worldometer'.
find()function is used to find the tag in the HTML script but it will only find the 1st tag it sees to find all the tags we use find_all() function which will give you all the tags on the webpage you ask to search for
By giving the command soup.find_all("table") we find all the tabes tags in the webpage and save it in all_table variable. After storing the tags we want to see how many table tags we got, print(len(all_table)) gives the number of tags we got. The type1()function is used to see the type of data we are having, type(all_table[0].text) the data in the 0-index table in the variable all_table is a String type
from IPython.display import HTML, We are using this library to show the data in HTML table design which is better presentable by using function HTML (table [0]. prettify ())
Transferring the data to CSV
To use the data efficiently we need to transform the data into CSV format, so that we can use it to generate more insides and make more analysis

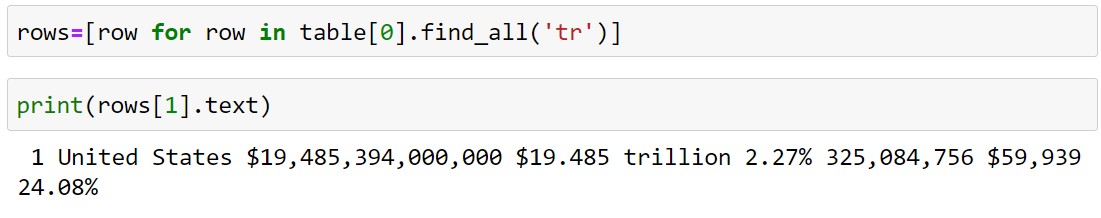
So now we will pick the data row-wise and store it into a list by using list comprehension. rows=[row for row in table[0].find_all('tr')] from table one we are finding all tr tags and putting them in the row variable and saving it in the list named rows.
print(rows[1].text) we see the data in the 1 row, as we know that rows are a list and to see the data we need to use the indexing concept if we will write print(rows[0].text) we will be getting the names of columns.
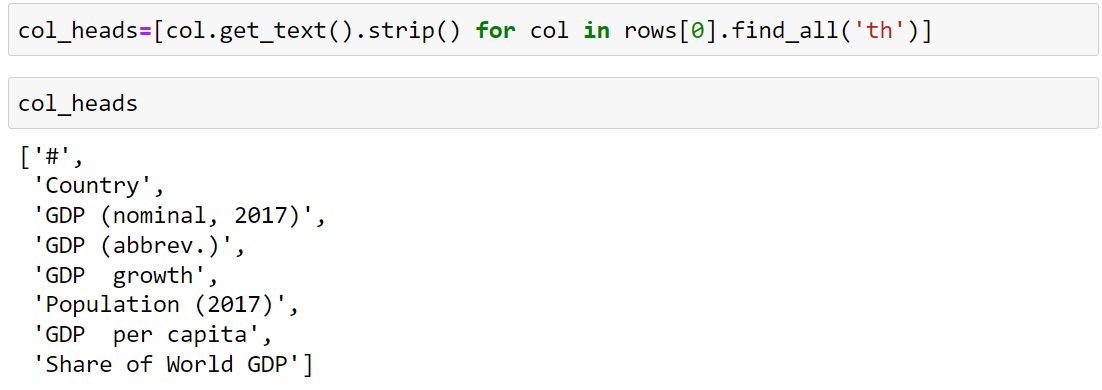
The col_heads=[col.get_text().strip() for col in rows[0].find_all('th')] – By find_all(‘th’) we find the name of all table headings and sending in the carriable col, before saving the data into a list format in col_heads we will split the names by using .strip(). As we see the output a list is created with the names of columns
Now
as we see we
separated the data
and the column's
name from each other
but before
converting it into a
data frame we need
to split the data of
td into a different
list and transpose
it.
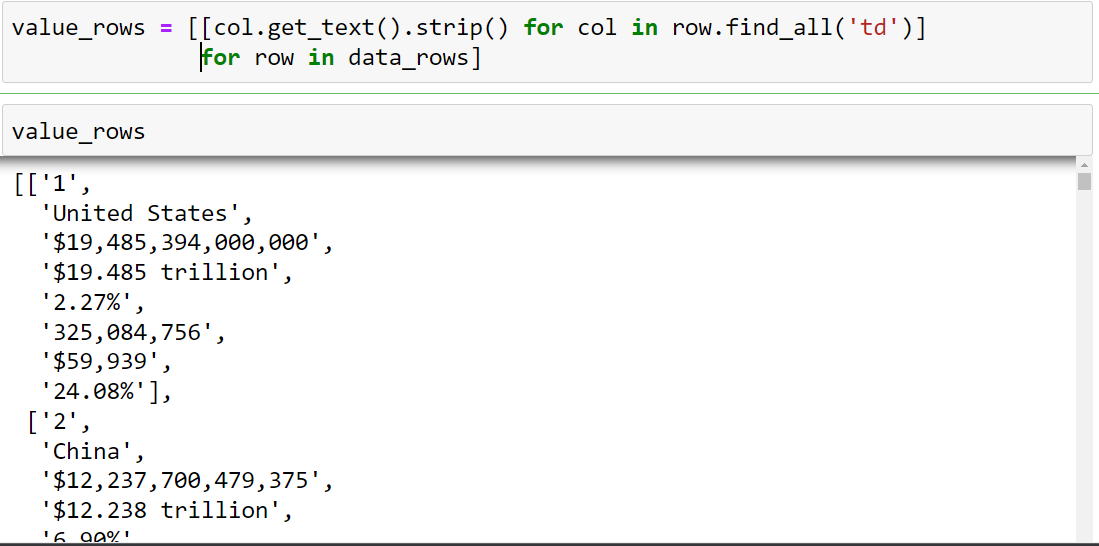
value_rows
=
[[col.get_text().strip()
for col in
row.find_all('td')]
for row in
data_rows]
in the loop first,
it picks the data
from data_rows(tr)
one by one in a
variable row and
sends it to the
inner loop where on
the bases of the tr
tag the data is
separated and then
striped and a new
list variable is
created as value_rows.

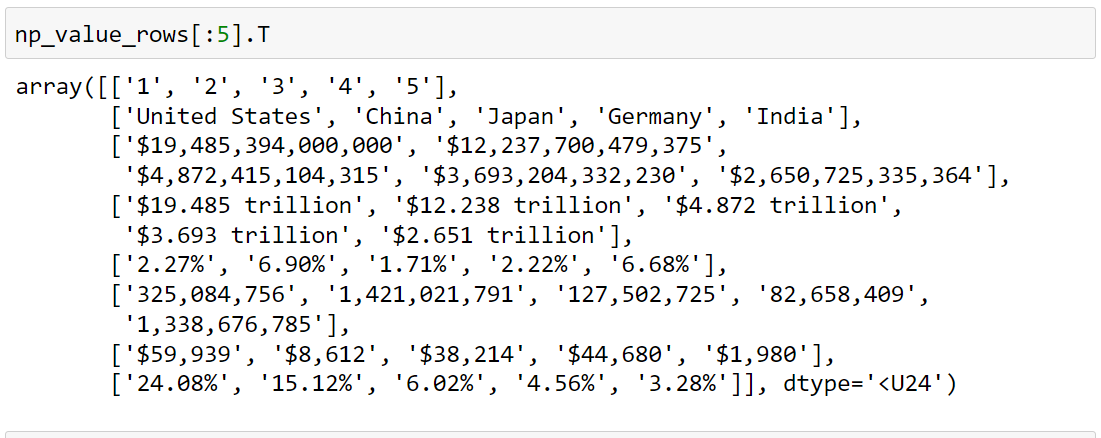
Now to transpose the data we need to convert it onto an array and for that, we will have to use the NumPy library. Why do we need to Transpose? As the data in the list will be converted as the data in the column we what that every list to contain similar data, for example, there should be a list of countries' names. By using the function of NumPy array() “np.array()” we convert the list into an array and we the top 5 records np_value_rows[:5]

The .T transpose the data is the same as pivoting table in MS Excel, as the result of command np_value_rows[:5].T we see that all the similar data is in a single list.
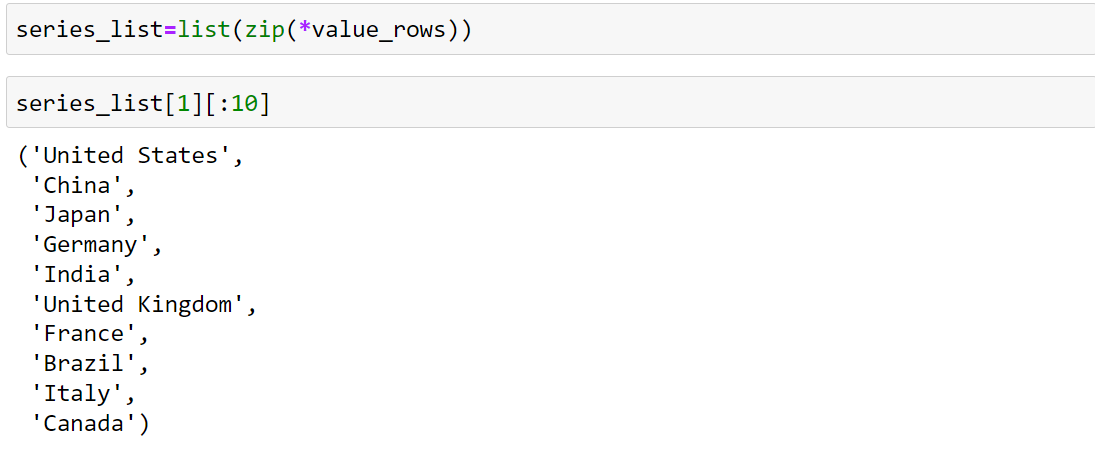
We zip up the data together of list by series_list=list(zip(*value_rows))
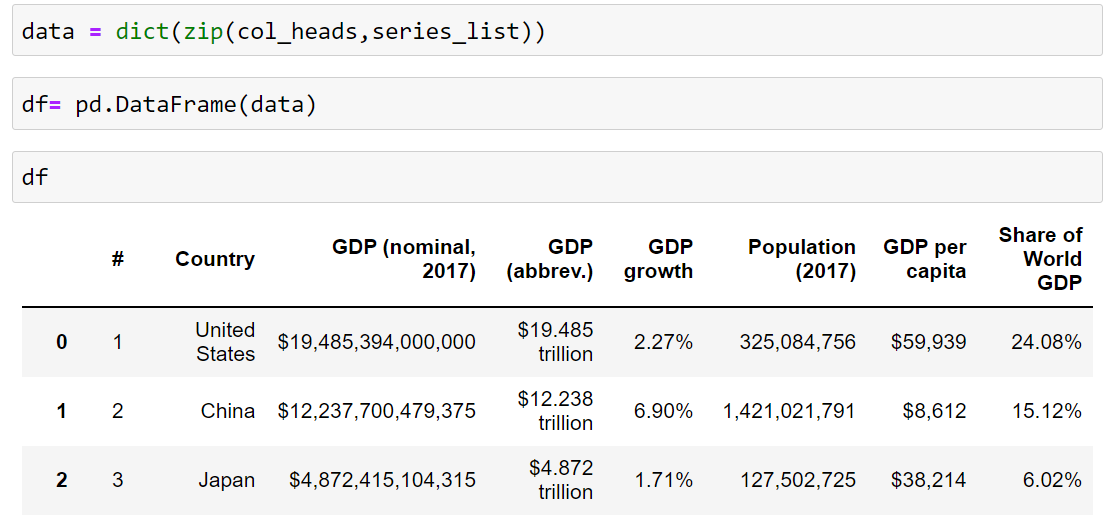
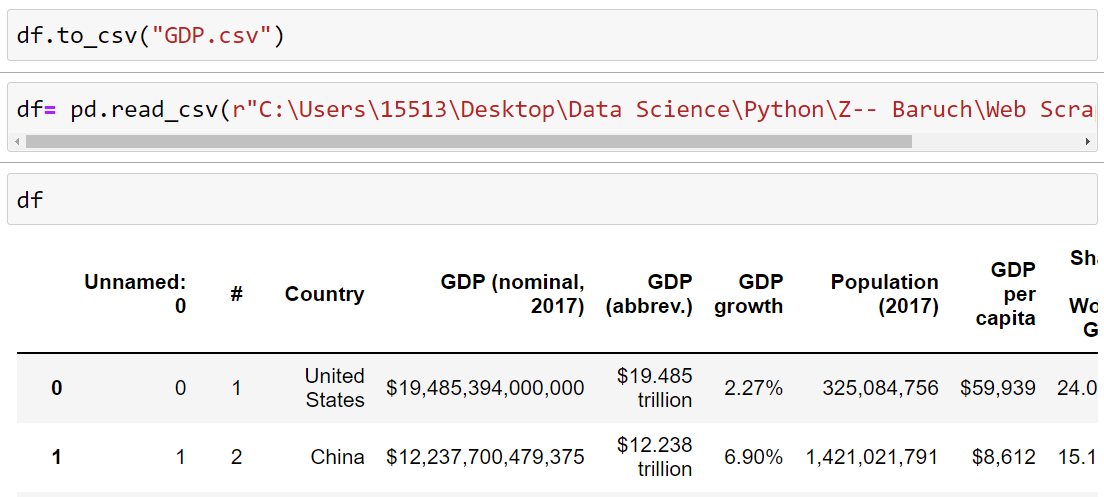
We zip up the column name in dict format together By using the Pandas library we convert the data into Dataframe df= pd.DataFrame(data) which is a structured format to be converted into CSV, df.to_csv("GDP.csv")
We read the CSV data which is saved in our computer with the help of Pandas library df= pd.read_csv(). But as we see this data is unworthy to be analyzed as it is uncleaned, we will process and clean the data in our next project Data Cleaning and Analysis